Welcome to
UNICEF Uganda Dashboard

71,858
Followers
615

217,046
Followers
368

2,249
Subscribers
45

40,660
Followers
1464

65,717
Followers
02
Please Note: The Statistics Shown Above Show An Increase Or Decrease In Page Fans From March 2024 to April 2024. These Statistics Will Be Updated Monthly.
Summary metrics for UNICEF platforms
Facebook Performance 2024
Metrics Overview
Total Impressions, Reach and engagements obtained in 2024
No Data Found
Facebook followers
This graph shows the trend in Facebook followers in 2024
No Data Found
Facebook Likes
The graph shows the trend in Facebook likes in 2024
No Data Found
X performance 2024
Total no. of Posts Published Jan- Dec 2024
No Data Found
Engagement and Likes Metrics Jan - Dec 2024
No Data Found
X impressions 2024
No Data Found
X followers
This graph shows the trend in X followers in 2024
No Data Found
Instagram performance 2024
Total no. of posts published Jan-Dec 2024
No Data Found
Total Reach, Impressions, Engagement 2024
No Data Found
Instagram followers
This line graph shows the trend of Instagram followers from Jan -Dec 2024
No Data Found
LinkedIn Performance 2024
Total no. of posts from Jan-Dec 2024
No Data Found
Reach, Impressions & Engagements Jan-Dec 2024
No Data Found
LinkedIn Followers
The graph below shows the trend in LinkedIn followers from Jan-Dec 2024
No Data Found
YouTube Performance
Number of videos published in 2024
No Data Found
YouTube reach, impressions and views 2024
No Data Found
YouTube subscribers
This line graph shows the trend in growth of YouTube subscribers in 2024
No Data Found
2024 Reach, Engagement and Impressions
This section looks at the total number of people UNICEF Uganda reached, engagement and impressions obtained across all platforms in 2024. Please note that the figure for Reach doesn't include people reached on X as the reach metric is unavailable on X.
No Data Found
Website analysis 2024
Number of articles posted Jan-Dec 2024
No Data Found
Website views 2024
This graph shows the number of page views got from Jan-Dec 2024
No Data Found
Users
This graph shows the number of users on your website in 2024
No Data Found
New users Vs Returning Users 2024
No Data Found
Total number of children related issues collected in January to April 2024
Sentiment
The majority (1,795) of the children-related articles published online from Jan to April 2024 had a Positive sentiment.
No Data Found
Mentions
Out of the 3,621 children-related articles we recorded that were published online from Jan to Apr 2024, 75 articles mentioned UNICEF Uganda
No Data Found
Keyword
The majority (1,589) of the children-related articles published online from Jan-Mar 2024 were on Keeping Children Learning
No Data Found
Observations
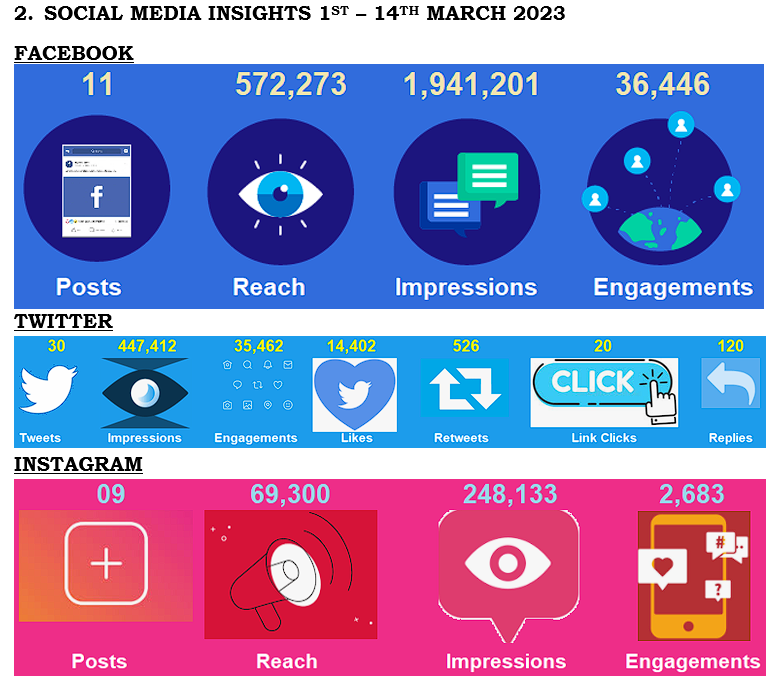
UNICEF Uganda got its highest impressions from Facebook, followed by X, Instagram, YouTube and lastly LinkedIn. UNICEF Uganda got its highest level of engagement from Facebook. In the first three months of 2024, UNICEF Uganda utilized different media formats namely; photos, videos, graphics, reels and stories in your posting. Keep up with this strategy as it keeps your users engaged in different formats. There was increased usage of your main hashtag, #InvestInUGChildren. -Regular posting on your social media platforms in different media formats -Boosting your content elevated platform performance.

5111433 +
Reach
Total number of people reached in Jan 2024 on Facebook, Instagram, LinkedIn and YouTube.

195167 +
Likes

14832483 +
Impressions

228431 +
Engagement
Total number of people engaged across all platforms.
From across the world
Countries across the globe that got people engaging with your content on the different social media platforms and your website.
No Data Found


